
Cannabis in Crisis: The Mold Situation
- Marco Troiani

- Mar 3, 2025
- 7 min read
Updated: Mar 4, 2025
Public discussions about mold contamination in cannabis are steadily increasing in the early part of 2025. Although this discussion goes back many decades in the legal cannabis market, and possibly even further in the illicit market of the late 20th century, accountability for exposing cannabis users to toxic mold is increasing as the industry becomes more properly regulated.
What this article is not may merit mentioning briefly: This is not an accusation of which individuals, organizations, or even sectors of the industry are responsible, as the media is saturated with countless accusations, open letters, and “hot takes” that cover that information. Furthermore, this is also not a sharing of public or anonymized data that shows the scope or extent of mold contamination in the industry, as there are several publications that cover that subject stretching back many years.
What this article does do is provide the tools that interested parties may need to both comprehend and participate in the discussion surrounding mold in cannabis. Once these tools are made available, they will be a serious asset when reviewing the data and publications addressed in the previous paragraph. We have organized this content into four major arguments that are employed in this public discourse to explore variation in mold counts in cannabis samples, summarized below:
1. The Re-Testing Argument (Temporal)
2. The Manipulated Dataset Argument (Statistical)
3. The Testing Technique Argument (Methodological)
4. The Legal Liability Argument (Regulatory)
For convenience the image number matches the numbering scheme used here to help organize these four pillars of the mold crisis. Let’s jump right into part 1: the temporal argument.
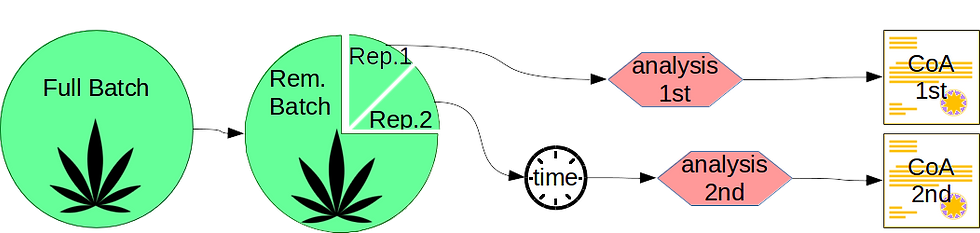
The re-testing argument, or the temporal argument, is a simple concept that claims that variations in mold reporting may be due to a later testing date for the 2nd test, which explains higher mold counts due to mold growth in that interim time period. The Certificate of Analysis (CoA) is the official lab document sharing the analysis results with the client producer and the state regulator.
Testing is done by sub-dividing a very small representative sample of the whole cannabis crop batch. In re-testing this sub-dividing is done twice, sometimes with a significant time delay between the two. Now the argument claims that multiplication by mold cells in that interim explains the higher reported numbers, which is certainly possible.
Things to consider include the fact that although mold can undergo both linear and exponential growth in the right conditions, cannabis storage conditions may not be compatible with these possibilities:
Air-tight containers limit the supply of oxygen to the microbes, which may limit or altogether stop microbial growth depending on whether the microbial species is facultative anaerobe or obligate aerobe respectively (facultative anaerobe means able to work with oxygen or without; obligate aerobe means fully requiring oxygen).
Low-moisture conditions, measured both by percent moisture content (%H2O) and water activity (Aw), also limit mold growth as well. Typical moisture content of cured cannabis is about 5-15%, whereas live plants that allow for full speed mold growth are closer to 85-95% moisture. Although harvesting the plant makes the tissue dead and helps mold grow faster, drying the plant matter counter-acts this effect, and past a certain point of dryness arrests all microbial growth altogether (consider cinnamon sticks, etc).
Now that we have covered some of the key factors to be cognizant of in temporal arguments about mold count variation, we can proceed to statistical techniques that look for manipulated datasets.
The second examined argument, surrounding statistical tools that demonstrate manipulation of data, is a strong indicator of intention rather than incompetence. This argument follows the statistically demonstrable anomalies that follow laboratory suppression of failing mold levels. Although the motivations for this manipulations could be anything, the most common cause in the industry according to many sources is the prevention of higher costs to cannabis producers by the laboratories partnering with them.
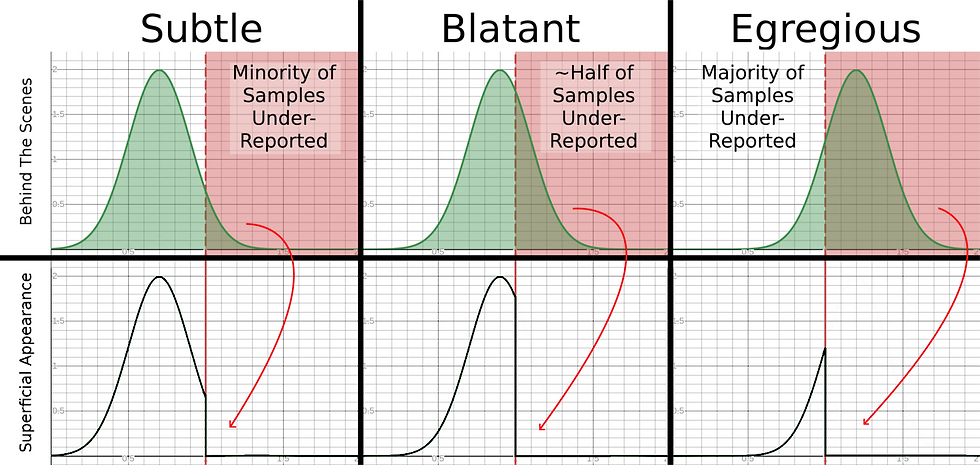
The main element to consider here is that any natural value, such as mold concentrations in cannabis grown in the same region, will follow a natural distribution curve, sometimes called a Gaussian curve (illustrated in Image02). Deviations from this distribution that exactly match regulatory limits can be a strong indicator of intentional manipulation of data.
Image02 illustrates how this manipulation would look when graphed visually. The image shows four cases, a subtle case, a blatant case, and an egregious case. Based on the shape of the curve, it is rather intuitive to group a lab’s mold data into one of these four categories (not including the fourth implied category: manipulated data, which would resemble a Gaussian curve).
Things to consider include:
The fact that Image02 shows the omission of failing samples altogether, when the reality is more likely to involve the movement of failing samples above the failure limit to “just below” that limit. This would show a big spike below the failure limit that would represent the “moved” samples and would change the shape of the graph accordingly.
Although mathematical concepts can be an abstract approach, the more practical way of thinking about this is “symmetry”. Is the distribution asymmetrical between the low end and the high end that interacts with the failure limit / action limit? This is the core concept and when communicated the right way can be rather intuitive. See Image02 for illustrations.
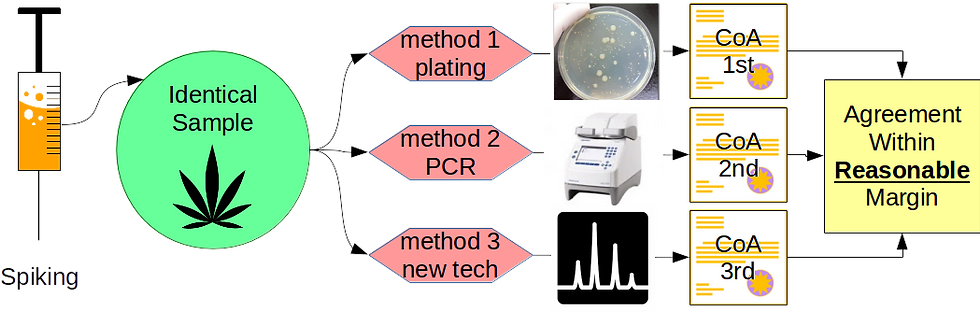
Now we cover the testing technique variation argument, or methodological argument, which asserts that differences in reported results on mold count can be explained by variations between analytical method techniques. This includes primarily the traditional technique, mold culture petri dish plate count, and the innovative technique, quantitative polymerase chain reaction or qPCR. Although this explanation seems reasonable with a generalized knowledge set, specialized knowledge about analytical techniques (including chemistry and microbiology) show that this explanation does not explain away all demonstrated variation.
Things to consider include:
The fact that all validated methods must show an accuracy and precision within a certain predefined margin of error, so arguments about a method being outside of a margin of agreement mean its invalid; furthermore, arguments about a method being valid mean its within a margin of agreement.
Unfortunately margin of error is a complex issue to define in chemical analysis, and an even harder one in microbial analysis due to the logarithmic nature microbial data. Despite these challenges, reasonable margins can be calculated on comparable food and environmental guidelines that mirror the needs of mold testing in cannabis.
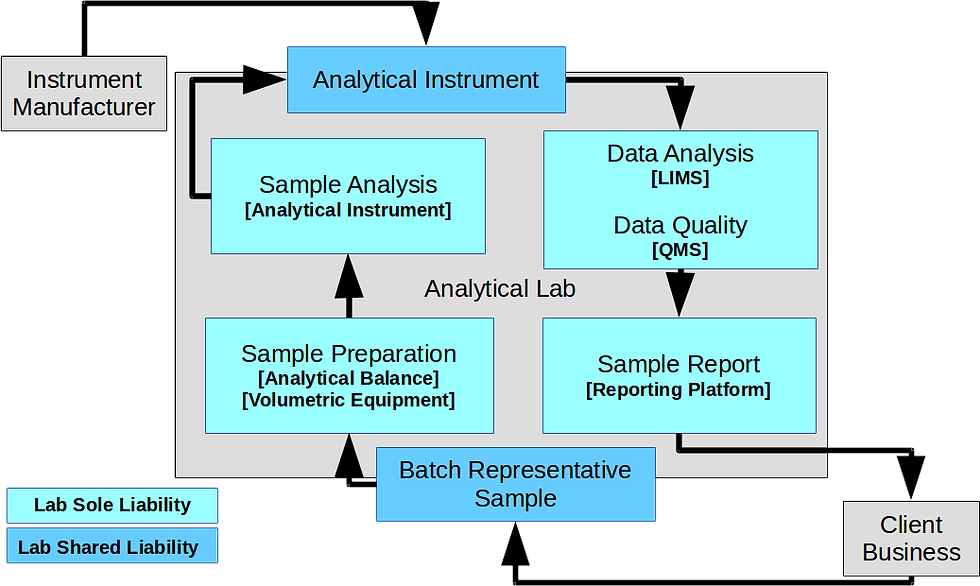
The fourth and final argument examined is that of the legal liability argument or the regulatory argument. This argument dictates that when an analysis is performed incorrectly, certain parties bear or share in the liability of that error. This primarily focuses on the testing lab, but also shares liability with the manufacturers of certain essential components of the analysis, such as the instrument, the consumables, the calibration standards, or the quality / check-safe standards. Another partner that may share liability is the client business patronizing the testing lab’s services, for example, for sharing in corrupt sampling practices to receive consistently more favorable testing results than impartial testing would be able to produce.
To help break down this scenario, let’s consider two opposite extremes, and then a tertiary intermediate scenario:
Firstly, the instrument manufacturer has developed a provably false methodology on its instrument and markets these false results to sell the instrument to otherwise well-meaning testing labs. The liability would fairly be placed more squarely on the instrument manufacturer than the testing lab, but both may share in the legal and financial fault of false laboratory data.
Secondly, the client soliciting testing services from the lab may be knowingly manipulating batches or corrupting sampling practices without the coöperation or knowledge of the testing lab. In this scenario the client would face a larger share of liability for false laboratory data than the laboratory itself, pending the available evidence to demonstrate and assert these facts.
Thirdly, the testing lab manipulates released data on a routinely validated instrument and without the coöperation or knowledge of the cannabis producing client. This would land the liability entirely with the lab and hold both the instrument manufacturer and the cannabis producing client harmless.
Unfortunately, it is the opinion of Digamma at this time that although some liability may be with instrument manufacturers and cannabis producing clients, the intentional manipulation of the complicit laboratory represents the lion-share of cases in the industry of toxic mold reaching consumers at this time. Although this is difficult to prove, the amount of control the testing laboratory has over the analytical process is much greater than other partners that may share in liability for erroneous laboratory data being released.
Separate from this process-based phenomenon, the motive / incentive model puts most of the pressure for this manipulation on the cannabis producing client. Because loss of cannabis batches to mold failures represents a financial loss for the cannabis producing client, they have the most to lose financially from failures and represent the driving force behind the trend to under-report mold and other contaminants in cannabis. This incentive is usually passed onto the testing lab through financial pressure that resembles a threat to terminate testing services with a lab pursuant to a single failed batch of product. Many in the industry term this phenomenon “lab shopping”, in reference to the practice of jumping from lab to lab to find a “passing test result”. Once a coöperative lab is found, the trend in the industry is to continue to patronize the services of the “passing” lab, a process which transfers the incentive from the cannabis producing client to the testing labs willing to under-report for mold or other contaminants.
This concludes our overview of the essential toolkit needed for comprehension and participation in the national conversation around mold contamination in cannabis. If you would like more resources about mold contamination in cannabis, including cases by jurisdiction, regulations by various states, data on average reported mold levels in each state, or other technical details, please don’t hesitate to reach out to our team and we would be happy to share this data. Many topics were omitted from this article in the interest of brevity and focus, so if you notice an adjacent topic it is most likely something we have materials to share on at this time.
Stay safe and always purchase cannabis from legitimate and trusted sources, especially if you are a medical patient. If there are questions you have outside the scope of this article, please don’t hesitate to let someone from our team know.
See our parallel article on Linked-In at the link below:


Comments